Early Predictors of Course Performance: Math 1010 Pilot Study, Fall Semester 2015
Prepared by Jeff Webb
AAB 355-Q • 4600 S Redwood Road • (801) 957-4110
March 10, 2017
Abstract
Is student performance in the first three weeks of the semester (specifically performance on early assignments and class attendance) correlated with course grade? SLCC’s math department conducted a pilot study to investigate this question during Fall 2015. Seventeen sections of Math 1010 were selected for the study. Instructors took daily attendance through the semester and administered early assessments (in the first 3 weeks) in the form of quizzes, exams, graded home-work, or other assignments. This report summarizes the results of that study.Summary of Results
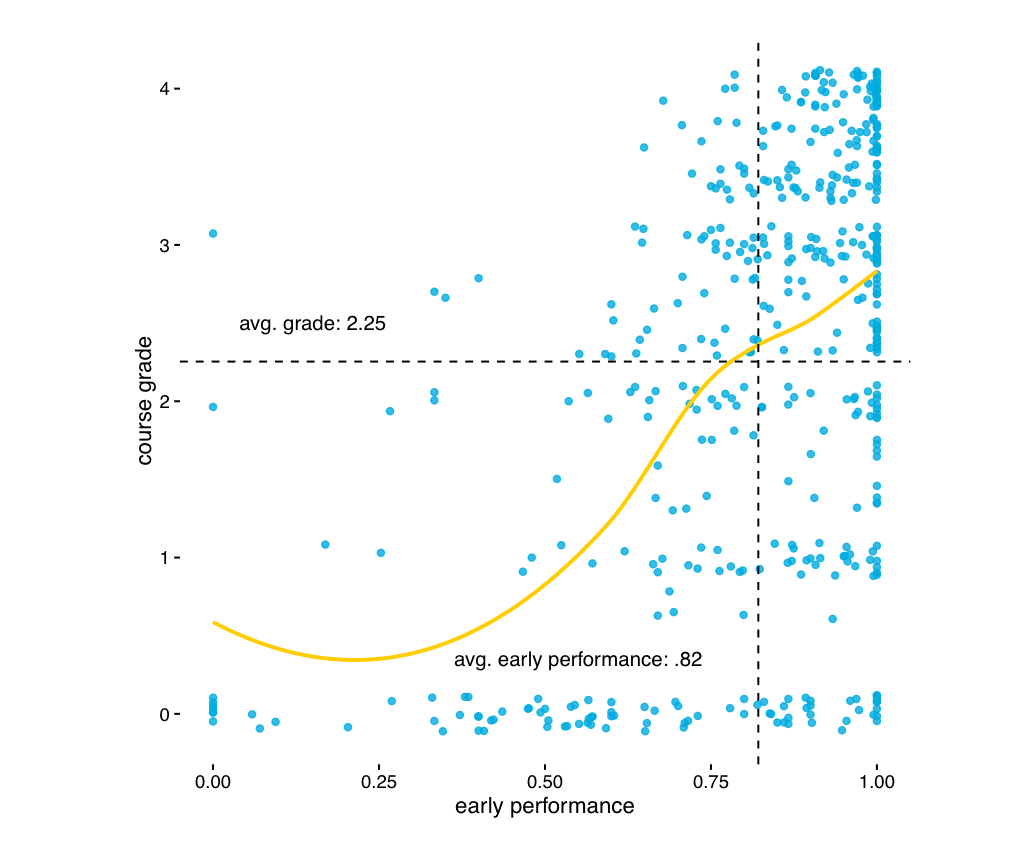
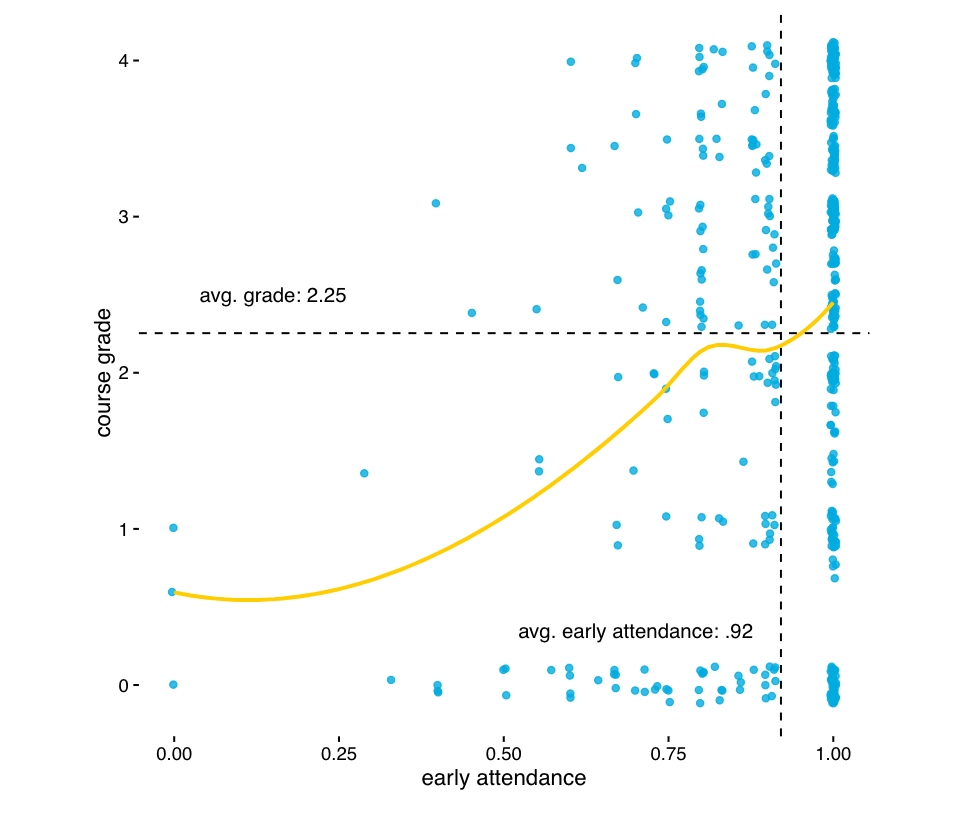
- Attendance and performance data collected before the third week drop date was strongly associated with student course performance.
- Adding a course late was weakly associated with student course performance.
- A predictive model using early attendance and performance information, along with other variables, was 73% accurate in predicting whether a student would pass the course. Such a model could likely be fine-tuned over time to improve overall predictive accuracy. However, not all errors are equally important. We argue that false positives (students incorrectly predicted to pass) are a bigger problem than false negatives in this context. The predictive model reported here had a false positive rate of 37%.
- Our very rough estimate is that an early warning and intervention program using this predictive model could impact Math 1010 pass rates by something like 10%, assuming the intervention was able to help 50% of the true negatives pass the class.
Course Grade by Early Performance, Math 1010, Fall 2015. Course grade is on the y-axis, transformed into a numeric variable (4 corresponds to an A, 3.7 to an A-, 3.4 to a B+, etc.). The blue points represent students and are “jittered”—randomly and minutely displaced— to avoid over plotting. Early course performance the percentage of points earned on assignments prior to the third week census is on the x-axis. The gold line is a smoothed average of grades at each early performance increment.
Course Grade by Early Attendance, Math 1010, Fall 2015. Course grade is on the y-axis, transformed into a numeric variable. The blue points represent students. Early course attendance—the percentage of eligible classes attended prior to the third week census—is on the x-axis. The gold line is a smoothed average of grades at each attendance increment.
(requires College login)

